All web developers understand the crucial role performance plays for a website, both in terms of the visitor experience and as a quality benchmark. Not to forget, conserving CPU cycles contributes to environmental sustainability, albeit in small increments.
So, how can you maintain high performance on your pages within Salesforce B2C Commerce Cloud? In this article, we’ll focus on server-side implementation. Salesforce offers numerous tools to enhance and diagnose performance issues, and we’ll explore a selection of these valuable resources!
Write performant code
It may seem like an obvious point, but many developers tend to overlook the importance of considering performance while coding. It’s common to get stuck on an issue for hours, finally, come up with a solution, and then feel hesitant to make any further changes to the code since it’s working.
However, it’s crucial to revisit the code and perform some refactoring. You may have inadvertently written loops or commands that consume precious milliseconds of processing time. As you review the code, ask yourself if every line of code is necessary and if better alternatives or out-of-the-box solutions are available.
Use Custom Caches for heavy-duty processes
If you have never heard about Custom Caches, time to read up!
Custom Caches can significantly enhance performance when you need to perform resource-intensive operations. Keep in mind that Custom Caches are only suitable if the process’s outcome remains constant.
For instance, you can cache the retrieval of configuration values from an external service or store an access token instead of fetching a new one for every request. Or, if you need to calculate the average of a custom attribute for all the variants of a master product, storing the outcome in custom caches is more efficient than calculating it repeatedly.
There are some things to keep in mind with Custom Caches:
- It is not site-specific, so include the site-id in the key. If you don’t, you might have some unexpected results.
- Caches in the application servers of the same instance are separated
- The cache can be cleared automatically in a lot of different ways, so don’t depend on cached values existing (replication, code activation, and time-based)
- You can only store a maximum of 20MB of data in total
- The cache is stored in memory and is not persisted
- Custom Caches can be turned off in the Business Manager
Don't forget page caching
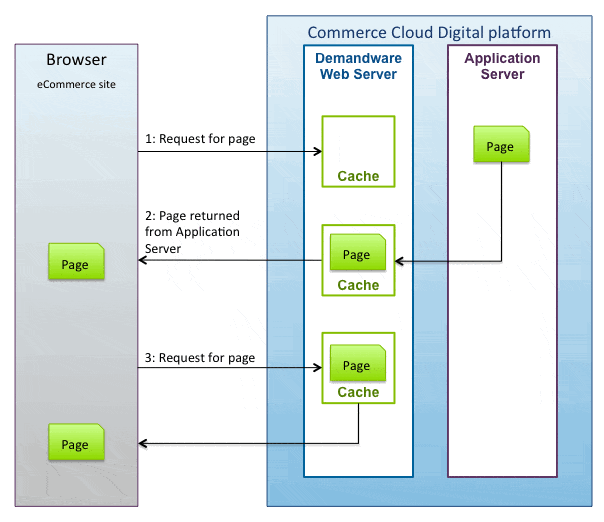
In simple terms, page caching stores the Application Server responses (HTML, JSON, XML, …) in the Web Server. By doing this, the requests coming from the browser don’t have to traverse the entire stack again to render the same content as before.
But how do you set this up? There are two ways:
I will not cover all of the details of what page caching offers. That deserves a dedicated blog post, as this can become quite the rabbit hole! And as luck would have it, there is a blog post about it (and more)!
Here is a link to part 2 of that same blog post for completeness.
Performance Debugging
Oh no… a certain thing hit the fan, and the product detail pages suddenly slowed to a crawl! But at first glance, you have no clue what the issue is.
You did a code release before this happened but can’t pinpoint the cause. Luckily there are some tools to help you out within the platform to do performance monitoring and debugging.
Technical Reports
We have live data since we are in production, which means “Reports & Dashboards” are available! Part of those reports is not about sales, but about performance! Just what we need!
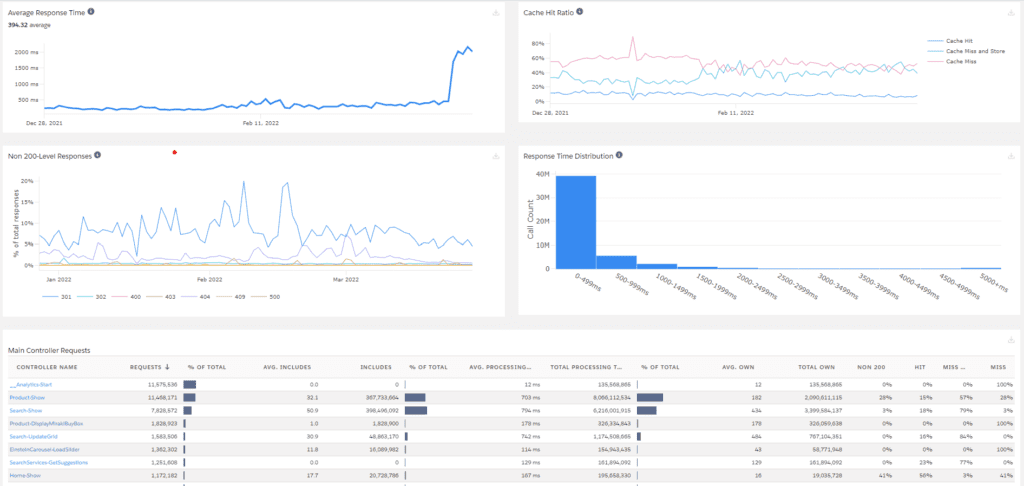
The Technical Dashboard (as it is called) gives us a great overview about:
- Average Response Time
- Cache Hit Ratio
- Error Rates
- Response Time Distribution
Looking at the list of data above, it makes sense to have a look at it!
This dashboard lets you obtain the essential information regarding your cache performance for all endpoints, including Remote Includes. Clicking on a controller will reveal insights into the various sub-requests caused by the Remote Include mechanism.
This dashboard is an excellent starting point for identifying caching issues and controllers with extended runtimes. The screenshot shows performance has decreased for the Product-Show controller over the past few days or weeks.
Pipeline Profiler
Don’t be fooled by its name; it will profile more than pipelines!
The second tool you should be grabbing ahold of is the Pipeline Profiler. It is easy to use, will give you a high-level overview of all of your pipeline/controller endpoints, and show you how much processing time it needs to do its thing.
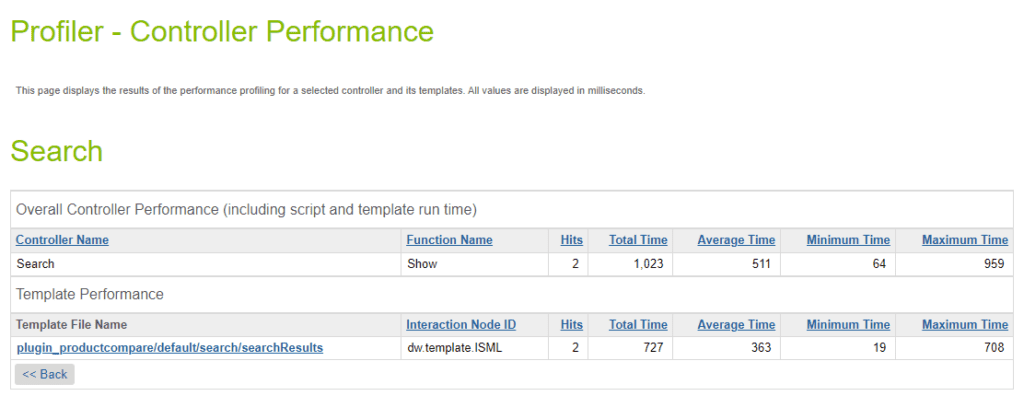
As you can see, the above screenshot shows a basic overview of the performance of a controller and the template (response) it renders. If the template uses local includes, you can see their processing time separately.
All of the Remote Includes you have done are within the list of controllers.
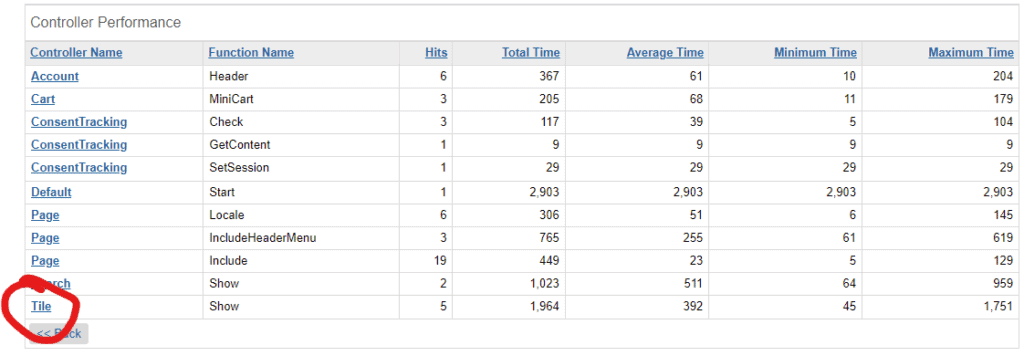
The information you get is quite basic, but it will give you the first indication of pain points and where to start looking. You can do this on production, but preferably as a last resort.
You should be able to reproduce the issue in a different environment, such as development.
Code Profiler
Last but not least, the Code Profiler provides you with detailed insights on run-time performance. You can control how detailed you want that information as it supports three modes: Production, Development and Extended.
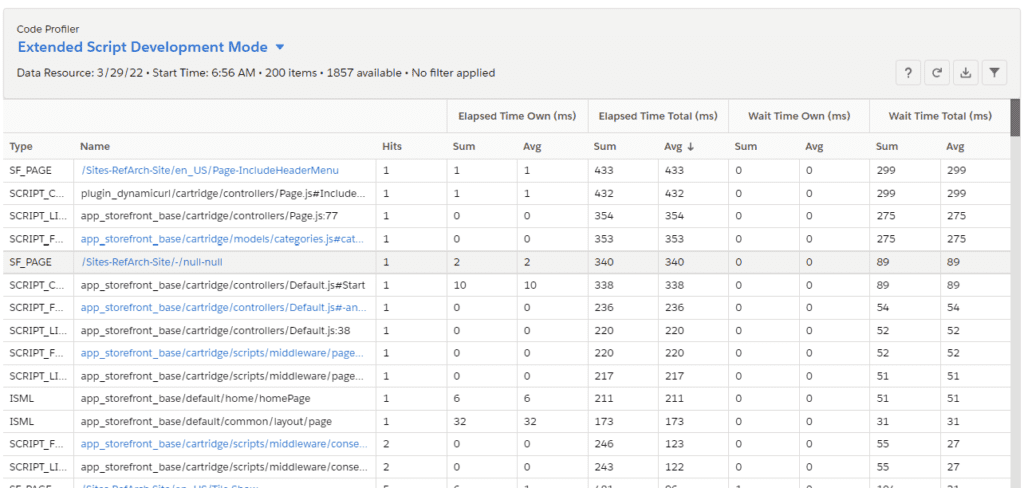
Looking at the screenshot above, you can understand why they call it “Extended Script Development Mode.” You get fine-grained details about the performance of your code, including information on which line in what JavaScript file.
This tool is your final stop for performance issues.
What about the Composable Storefront?
Although the Pipeline Profiler isn’t applicable in this scenario, you can still utilize the Technical Reports and Dashboards in conjunction with the Code Profiler.
Reports & Dashboards
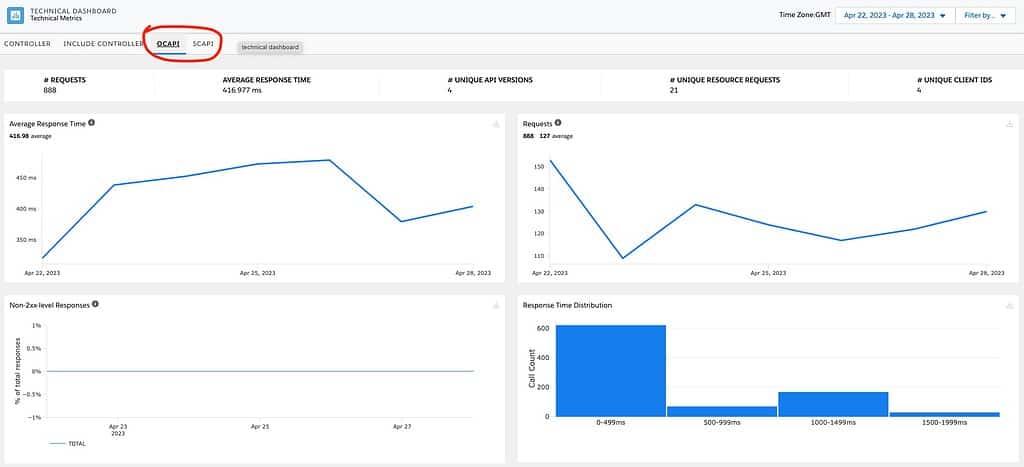
Within these reports are dedicated tabs for OCAPI and SCAPI performance!
Code Profiler
This report includes all Custom Hooks implemented for SCAPI and OCAPI, providing you with the opportunity to analyze the performance impact of your API customizations.
Conclusion
Server-side performance is a crucial factor in ensuring the success of any website, and B2C Commerce Cloud is no exception. In today’s fast-paced digital world, users expect websites to load quickly and efficiently, and any delays or lags can result in a negative user experience. This can lead to a loss of potential customers and revenue for businesses.
A performance debugging flow could look like this:
- Production: Look at Reports and Dashboards (Technical Dashboard).
- Development: Run the Pipeline Profiler to see if you have similar results as on the dashboard.
- Development: Run the Code Profiler to look for the lines of code that cause the performance issue.
